Talking Tech: Successfully Use Table Group Data Source in Design Integrations
Meet the Author

Let’s Talk Tech.
Accordion’s “Talking Tech” series explores how different CFO Technology solutions can empower finance functions to support organizational strategic initiatives – by implementing business process recommendations, optimizing operations, and capitalizing on value creation opportunities.
Now, let’s take a look at how to use table group data source in design integrations to calculate weekly numbers.
Reporting and data analysis on week numbers is key for various business segments. Calculating week number from your date fields should be a simple process during your integration. With Table Group Data Source this can be easily accomplished when bringing your source data into Adaptive.
A table group is a data source that combines tables from many disparate sources. You can compare it to creating vlookup formulas in excel, where you match values of a column from two different tables, and then you are able to reference the values of other columns based on the matching column. For example, you might have a spreadsheet with sales data, a couple of JDBC databases that have personnel or inventory information, manufacturing information from another division in NetSuite, and then want to use scripting on a table to do complex filtering and calculations, with all these tables linked by SQL joins and additional filtering.
Use Case for using Table Group Data Source
Adaptive users want to calculate week numbers on the data source and bring it as a dimension in their loaders so data analysis/ reporting can be done based on week numbers (not utilizing “Time” to have week numbers).
Functionality Gap
- Configuring time to include week number is cumbersome in Adaptive as the same week number can fall in two different months. Adaptive does not allow the same week number to fall in two different months.
- Utilizing SQL Week functions in the Adaptive “Custom SQL Column” option is not available
Solution Description
There are three steps to this solution:
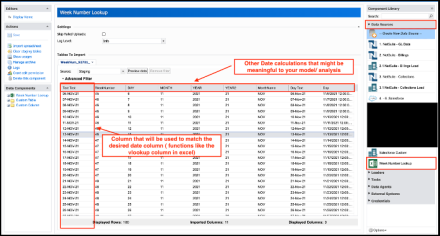
Step 1 : Create a Spreadsheet Data Source that contains each day of the year and the week number it represents (. Make sure that the column with day of the year matches the same format as the date field you are trying to extract the week number for). Other columns can be used to calculate other wanted values. One suggestion is to create this file to contain several years of data, so you don’t have to update it every year.
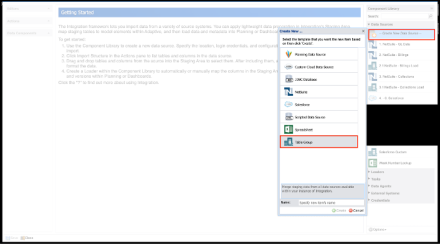
Step 2: Create a Table Group Data Source.
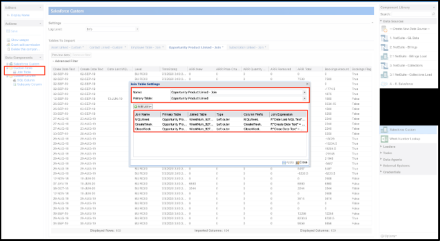
Step 3 : Configure the newly created Table Group to join the desired data sources previously created. During this step you can create as many “join tables” as needed, and link as many tables (from different data sources) as necessary. The key here is to make sure you have all your data sources created with the columns that you will use to join them.
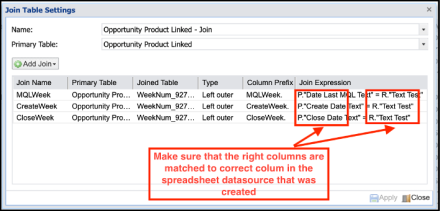
Make sure that in the Join Expressions, you are joining the correct columns in both sources. This is key in making sure you will be able to derive your week numbers from the date field.
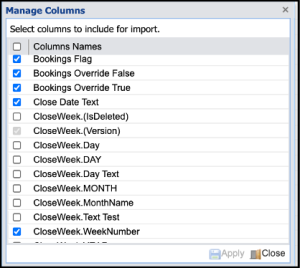
Once that configuration is finalized, make sure that all the fields that you need are available in your join table. Make sure you select the derived week number field at this point.
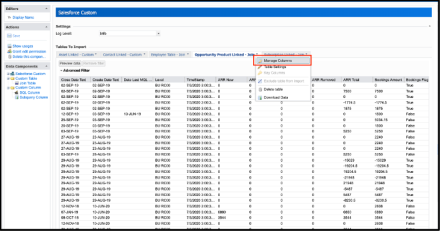
Once all fields are available in the new table, you can utilize the loader and reference the week number fields to match a dimension in your models in Adaptive. Once the data is in Adaptive you can utilize the normal HTML reports, dashboards and Office Connect reports to reference the week number dimension and be able to slice and dice the data according to your needs.
About the Author
